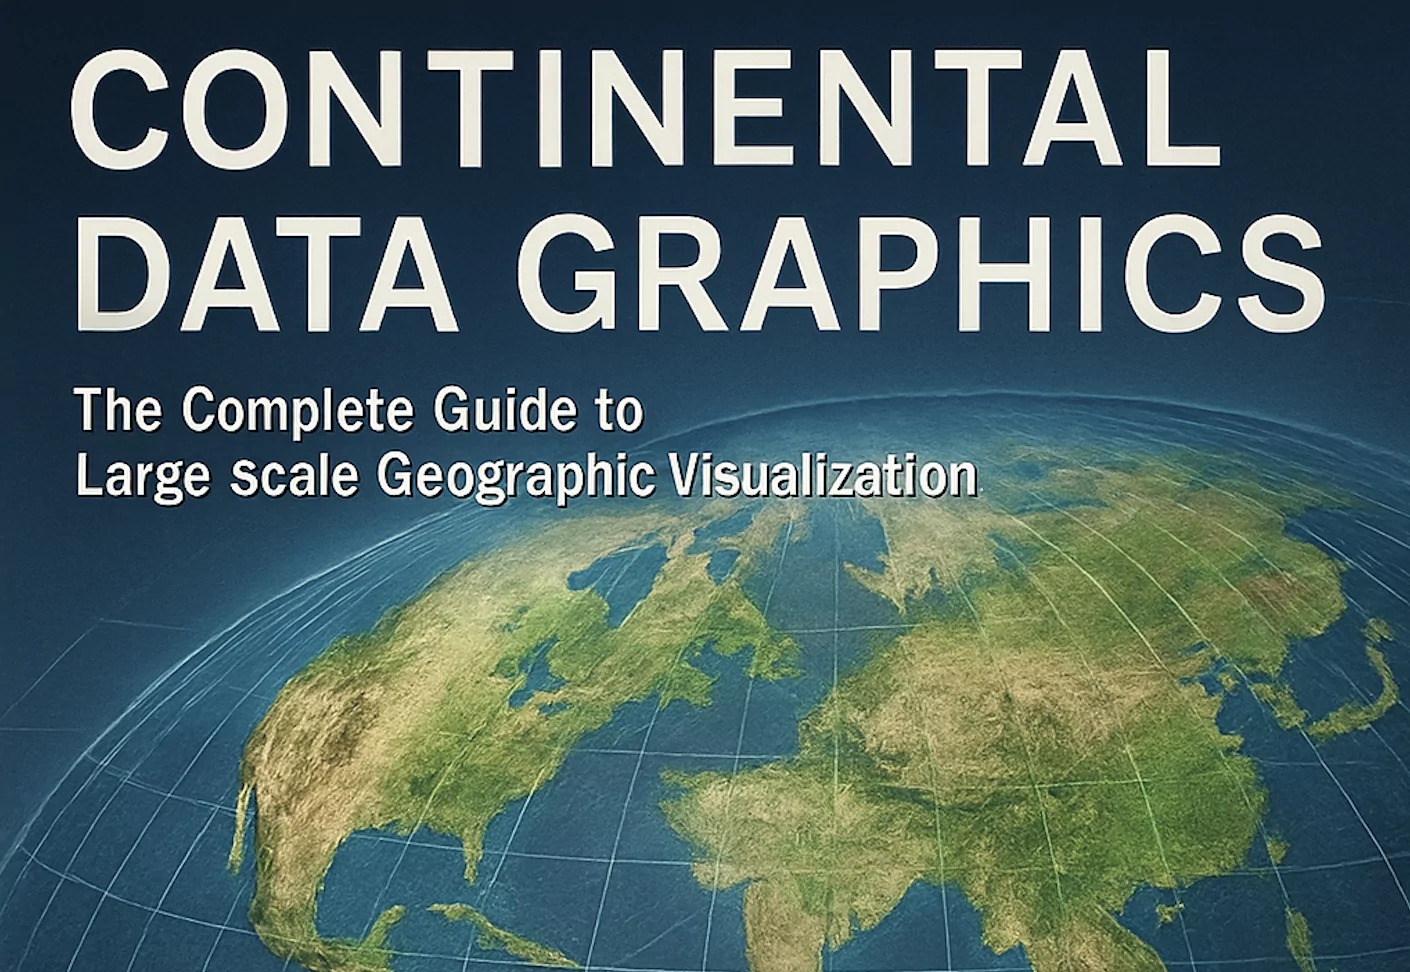
Continental Data Graphics: Full Guide to Geo Visualization

Continental Data Graphics (CDG) refers to the visualization of spatial data across large continental or regional scales. It combines geographic information systems (GIS), cartographic design, and data analysis to present complex data in a visual, easily interpretable format. This guide explores the concepts, tools, and techniques used to create large-scale geographic visualizations, helping professionals across industries—from urban planning to environmental science—make data-driven decisions.
Understanding Geo Visualization
What is Geographic Visualization (Geo Visualization)?
Geo Visualization is the process of representing geospatial data visually through maps, graphs, and charts. It allows users to observe spatial patterns, identify trends, and make informed decisions using interactive or static visuals.
Key Objectives of Geo Visualization:
- Make complex spatial data understandable
- Highlight patterns and relationships in data
- Support geographic analysis for decision-making
What Are Continental Data Graphics?
Defining Continental Data Graphics
Continental Data Graphics focuses on visualizing geographic data that spans vast areas—such as entire continents or large countries. This requires specialized tools and techniques to handle:
- High-resolution satellite data
- Complex topographical layers
- Large datasets from sources like remote sensing and IoT sensors
Use Cases Include:
- Climate change modeling
- Continental transportation networks
- Migration and demographic shifts
- Infrastructure development planning
Tools Used in Large-Scale Geo Visualization
1. Geographic Information Systems (GIS)
Software like ArcGIS, QGIS, and Mapbox allow users to manage, analyze, and display geospatial data at any scale.
2. Remote Sensing and Satellite Imagery
Tools like Google Earth Engine and NASA Worldview provide up-to-date satellite imagery to map land cover, vegetation, and climate patterns.
3. Data Visualization Platforms
Platforms such as Tableau, Power BI (with map plugins), and D3.js support integration with GIS data for dynamic and interactive maps.
4. Big Data & Cloud Storage Solutions
Amazon Web Services (AWS), Google Cloud Platform, and Microsoft Azure offer scalable infrastructure for processing continental-level datasets.
Techniques for Effective Visualization
1. Layered Mapping
Using multiple layers (e.g., population density, weather, elevation) provides richer insight.
2. Color Gradients and Choropleths
Effective color usage helps communicate density, frequency, or intensity of spatial data.
3. Heat Maps and Flow Maps
Visualizing traffic, human migration, or trade routes is easier with heat and flow maps.
4. 3D Terrain Modeling
Tools like Cesium or ArcGIS Pro offer 3D capabilities for more realistic continental topography.
Data Sources for Continental Visualization
Government and Scientific Institutions:
- NASA Earthdata
- USGS Earth Explorer
- European Space Agency (ESA)
- OpenStreetMap
Environmental & Socioeconomic Data:
- World Bank GeoData
- Global Land Cover Facility
- Natural Earth Data
Custom Satellite Feeds:
For real-time or high-resolution data, companies often subscribe to services from Planet Labs, Maxar, or Sentinel Hub.
Applications of Continental Data Graphics
1. Environmental Monitoring
Track forest coverage, desertification, and melting glaciers over decades.
2. Urban and Regional Planning
Analyze urban sprawl, plan roadways, and manage cross-border infrastructure.
3. Agriculture and Land Use
Map soil conditions, crop cycles, and optimize land usage at a continental level.
4. Public Health and Disaster Management
Identify patterns in disease outbreaks, natural disasters, and deliver predictive analytics.
5. Defense and Intelligence
Monitor military movements, border surveillance, and strategic planning using live satellite feeds.
Best Practices in Continental Geo Visualization
1. Prioritize Clarity
Avoid visual clutter; use clear legends and minimalist designs to enhance readability.
2. Maintain Data Accuracy
Verify sources and metadata to ensure credibility.
3. Consider User Experience
Interactive maps should be responsive, intuitive, and fast-loading.
4. Use Standard Projections
Apply consistent map projections like Robinson or Winkel Tripel for large-scale readability.
5. Make It Accessible
Ensure compliance with accessibility guidelines—color contrast, keyboard navigation, and screen-reader support.
Future of Continental Data Graphics
AI & Machine Learning Integration
AI models can analyze large volumes of geographic data to detect anomalies and make predictions automatically.
AR & VR in Mapping
Immersive visualization will allow stakeholders to explore data in real-time environments.
Crowdsourced Mapping
Real-time updates from IoT devices, drones, and public contributions can keep maps current and rich in context.
Sustainability Insights
Data graphics will play a crucial role in monitoring global sustainability efforts—from carbon emissions to biodiversity tracking.
Summary: Why It Matters
Continental Data Graphics is revolutionizing the way we understand the world. From climate action to global logistics, geo visualization at this scale empowers governments, scientists, businesses, and citizens to take strategic actions based on real insights.


